Browser Developer Tools
Our browsers come with built-in set of web authoring and debugging tools, that can help us in our web development process. Use the DevTools to iterate, debug, and profile your site. Some of the common tasks are:
- See and interact with the HTML of the page
- See and interact with the CSS of the page
- Output JavaScript console messages and look for errors
- Inspect individual elements on the page to see and change the styles applied
- Check the performance of the page
- Check the network requests made by the webpage
Accessing Developer Tools
Chrome and Firefox
In Chrome and Firefox we can open the dev tools by any of the two methods:
- Right click on the element you want to see the code for and select the Inspect or Inspect Element option
- Press
Command + Option + i(on Mac) orControl + Alt + i(on Windows)
This will open a window at the bottom of our browser.
Chrome Developer Tools 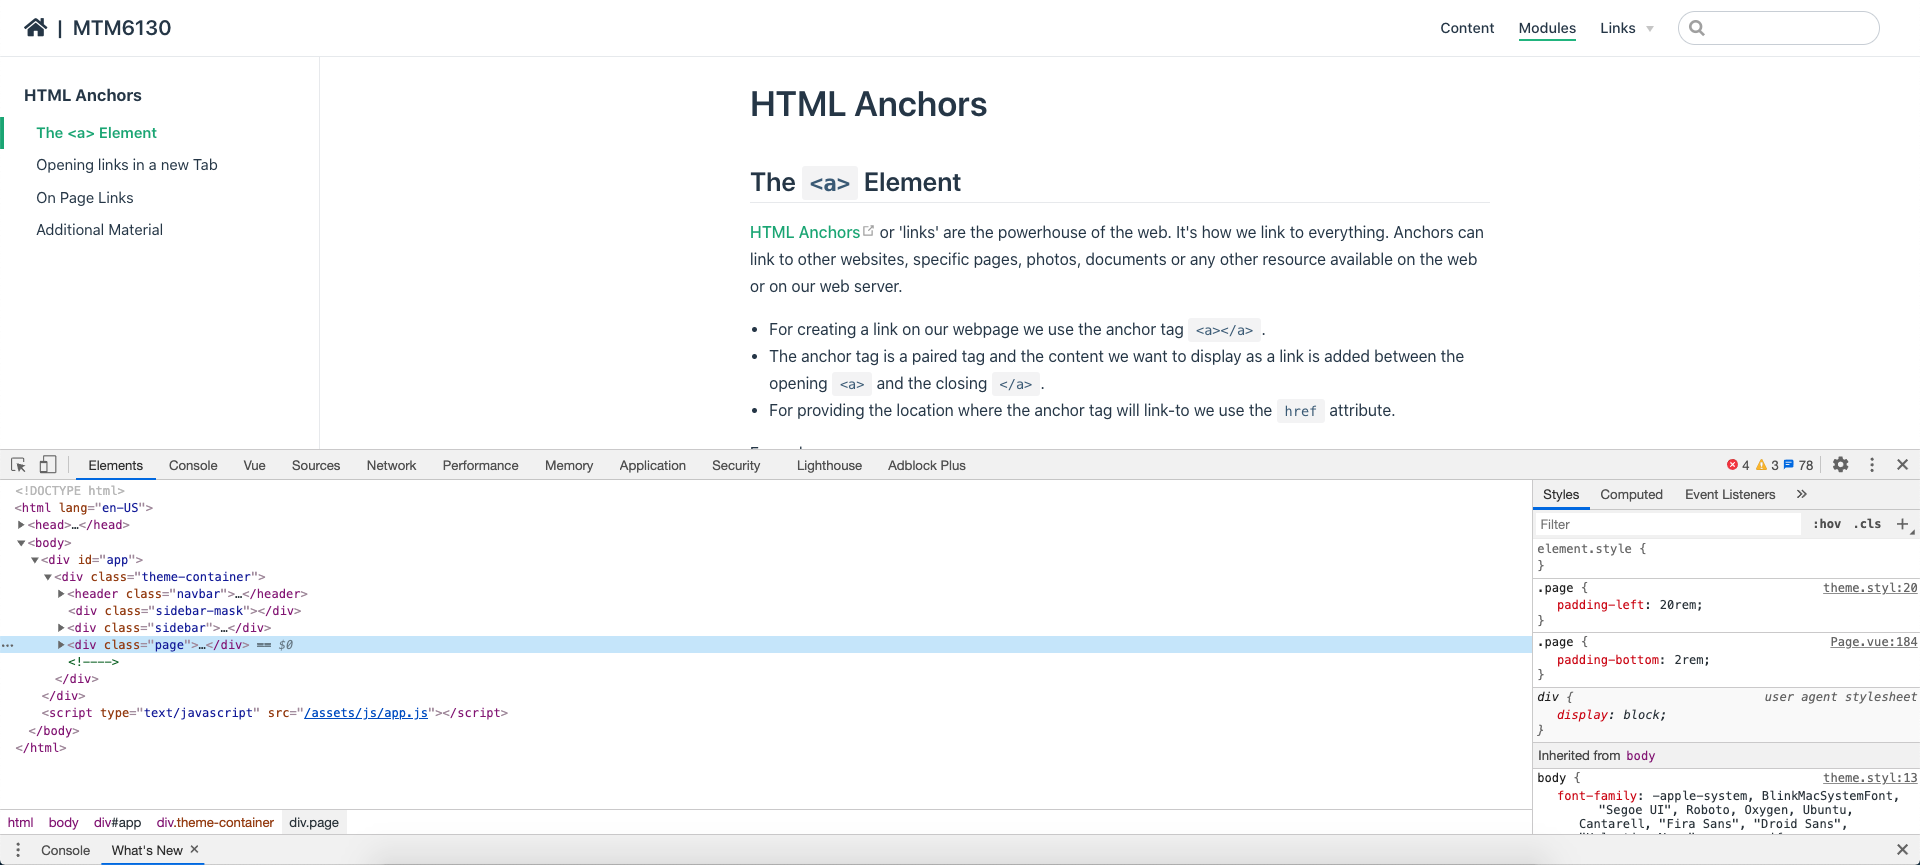
Firefox Developer Tools 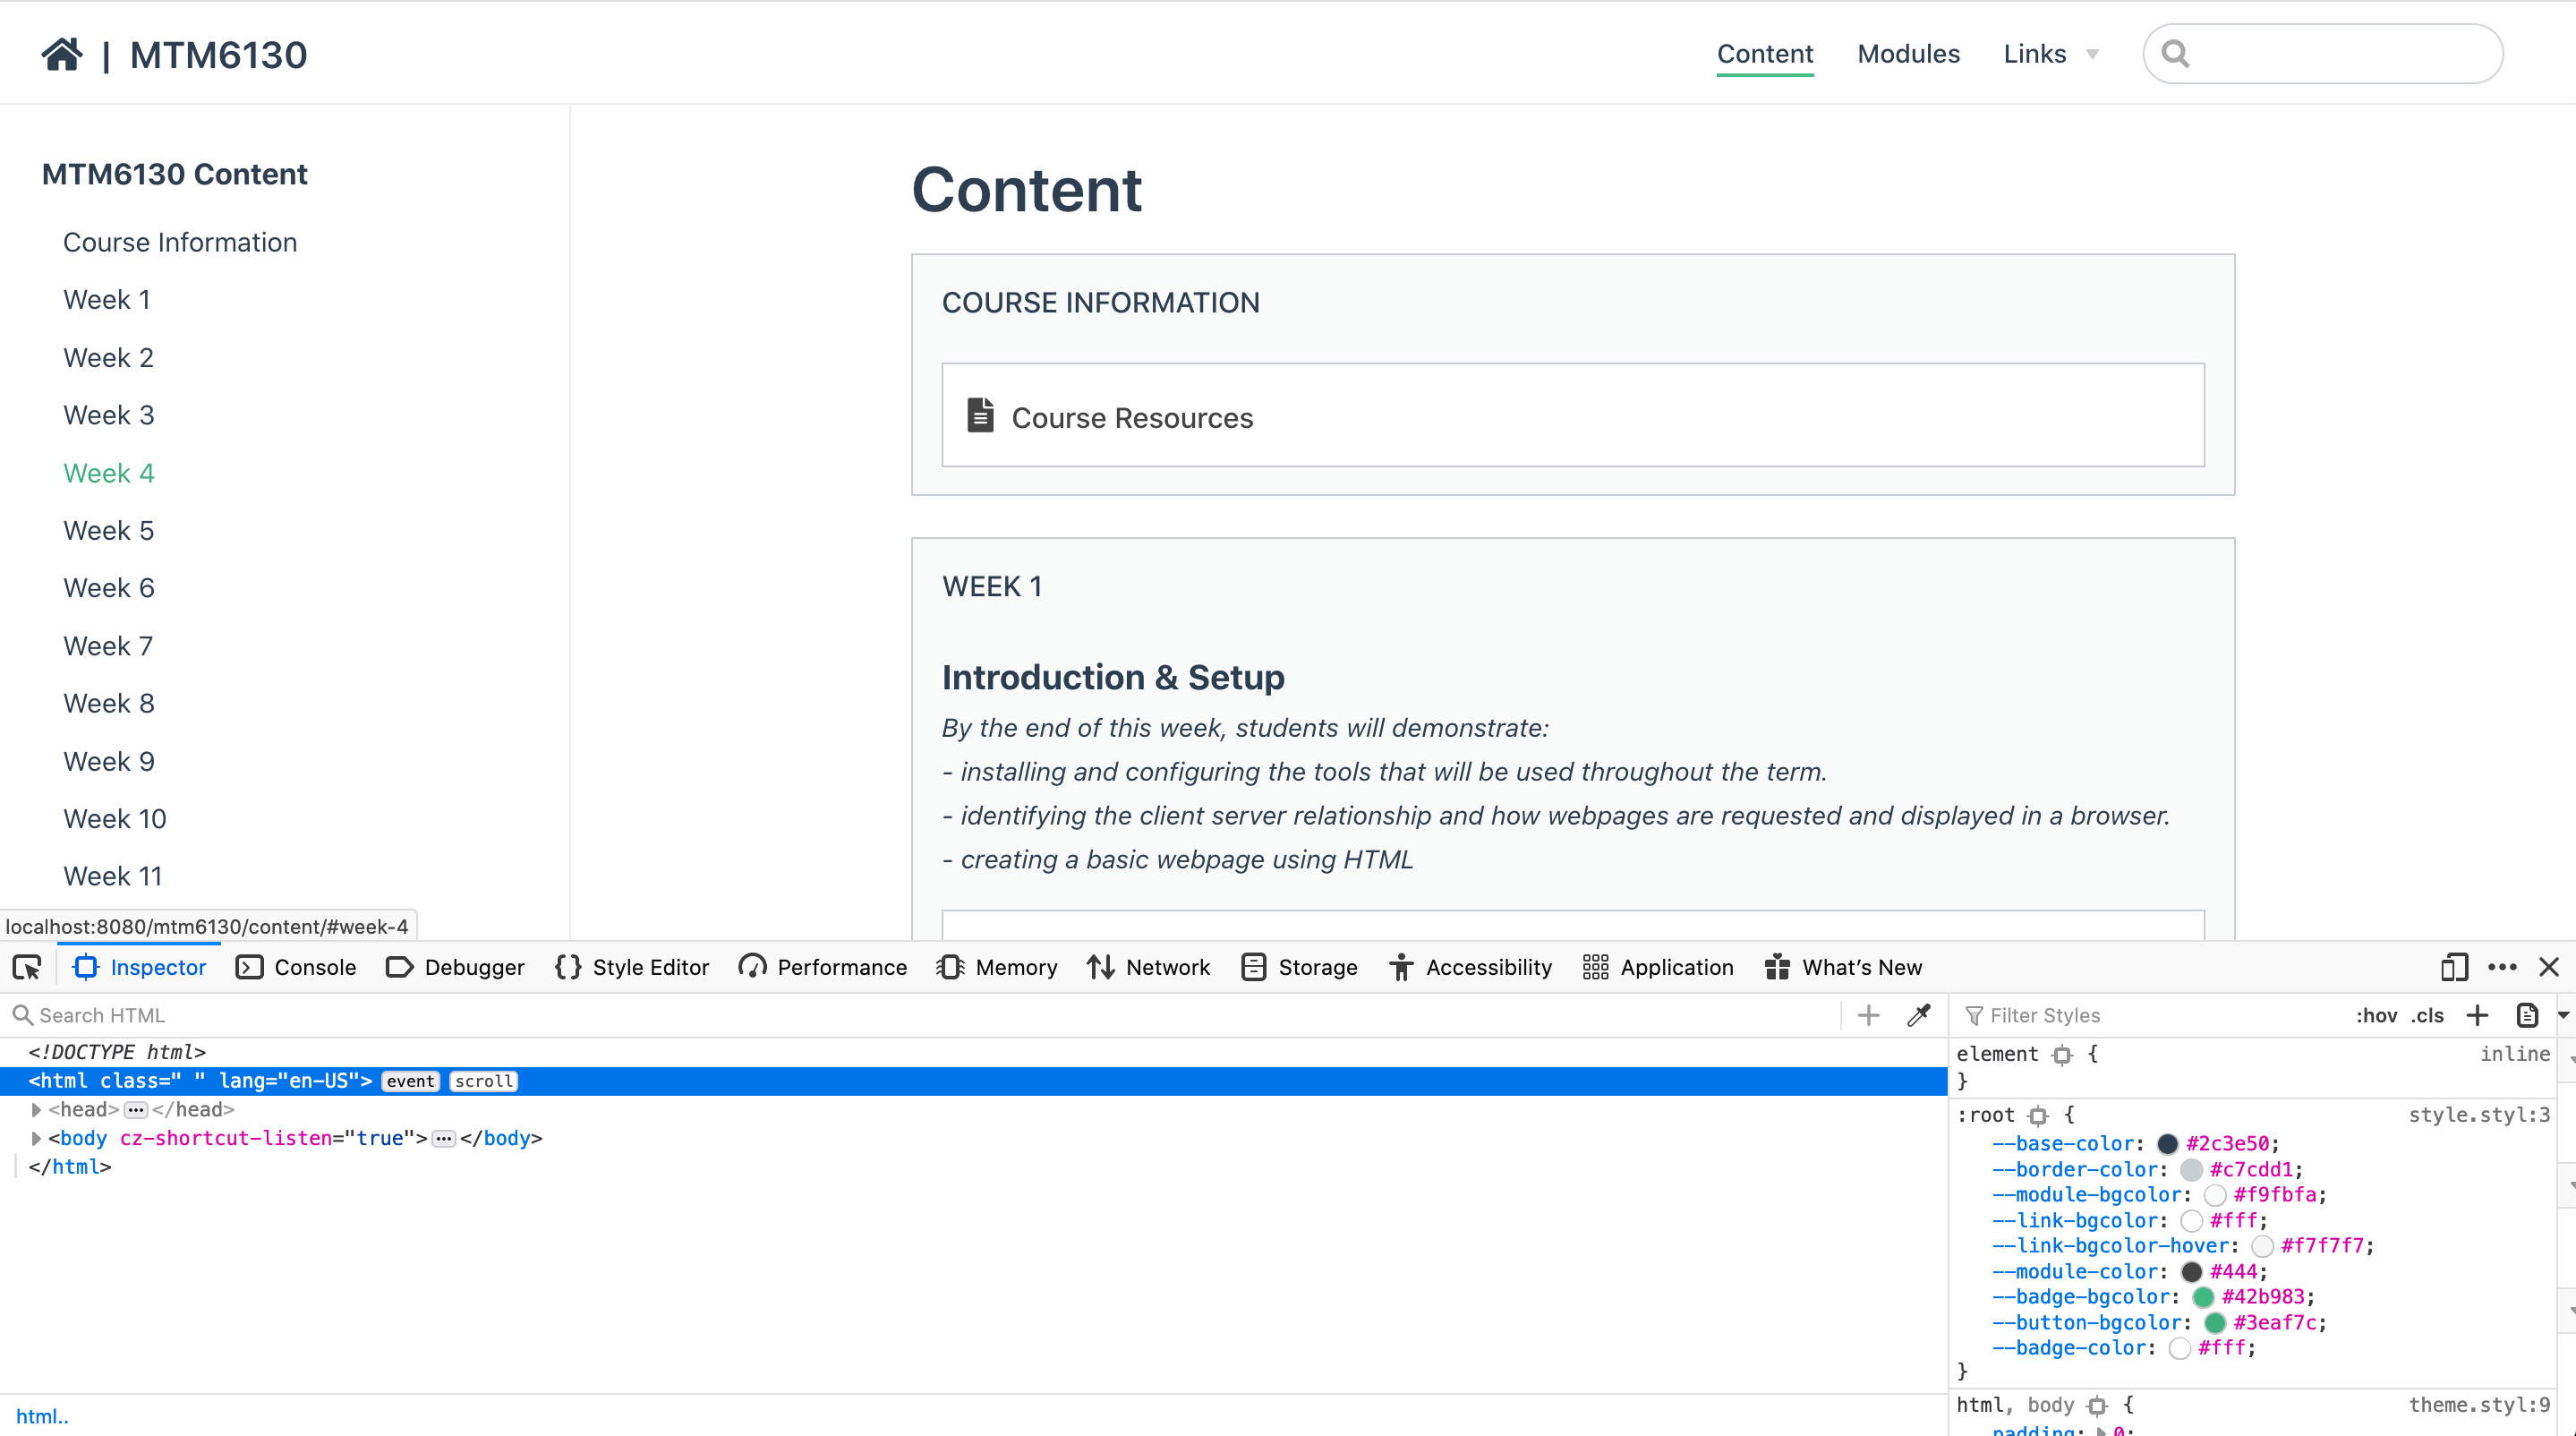
Safari (macOS only)
By default, access to the developer tools in Safari is turned off. Follow the steps below activate the developer tools:
- While in Safari, open Safari's Preferences found under Safari > Preferences
- Select the Advanced tab
- Check the "Show Developer menu in menu bar" box
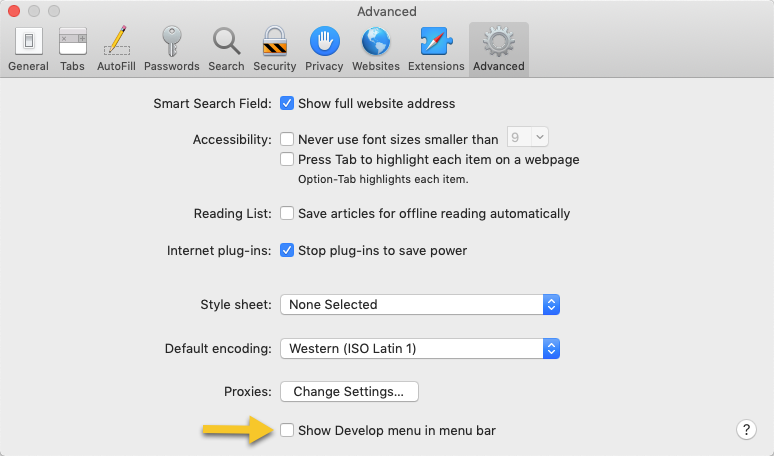
Once we have turned one the Develop Menu option we can access the developer tools in the same was as Chrome And Firefox.
Understanding Options
Most developer tools have similar options and labels for them. We will be looking at the screenshots from Google Chrome.
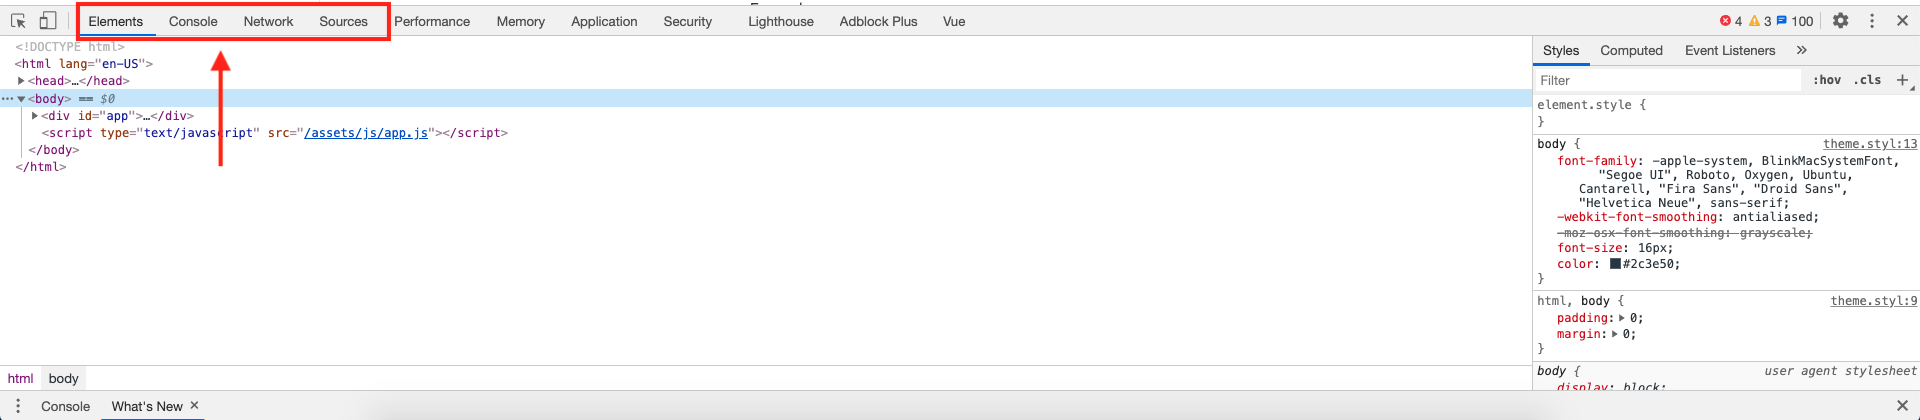
Tabs
There are different tabs available in dev tools. The most commonly used options are:
- Elements - Viewing and editing HTML elements and styles applied on the elements in CSS
- Console - Used with JavaScript, where we can output information using JavaScript and see any errors in running our JavaScript
- Network - Displays the files downloaded by our webpage and information about each file
- Sources - More information about each file used on the webpage
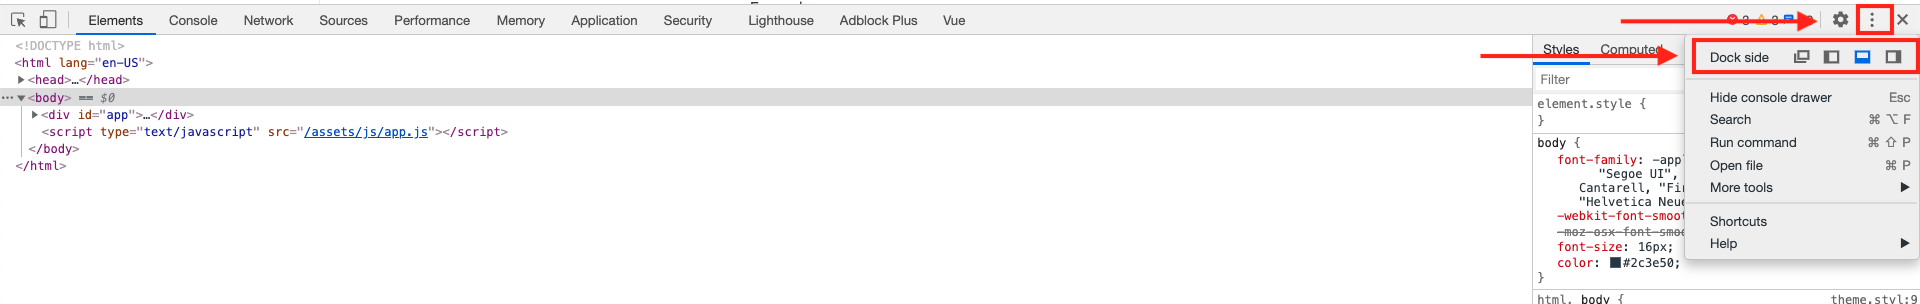
Changing the location of DevTools
We can change the location of the dev tools to the bottom(default), left side, right side or out of the browser window by:
- Clicking on the three dots for more options in the top right of the dev tools window
- Selecting the icon for the location we want the dev tools to appear in
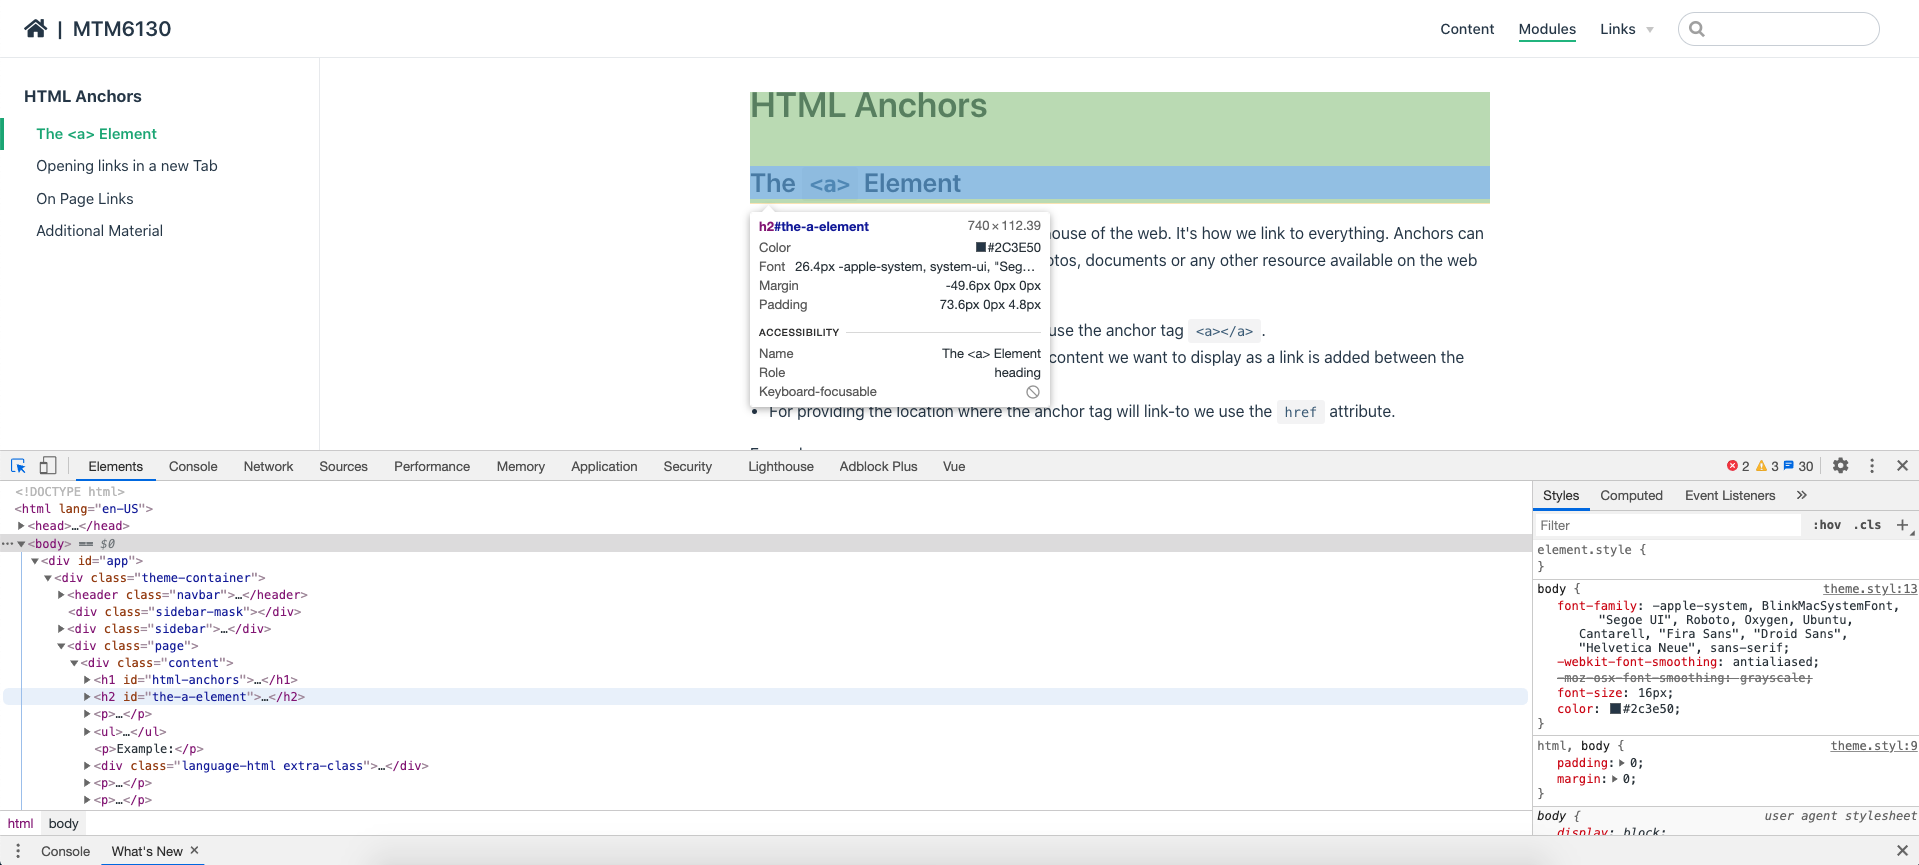
Element Inspector/Selector
To easily inspect different elements on the page and select an element to see the styles applied on it. We can use the inspector/selector tool. 
Once we have selected the tool we can hover over elements to inspect them and click on an element to select it.
Responsive view
We can test our webpage on different screen sizes and see how the website content will display by using the responsive view tool.
Switch between the responsive view and normal view by clicking on the responsive view option 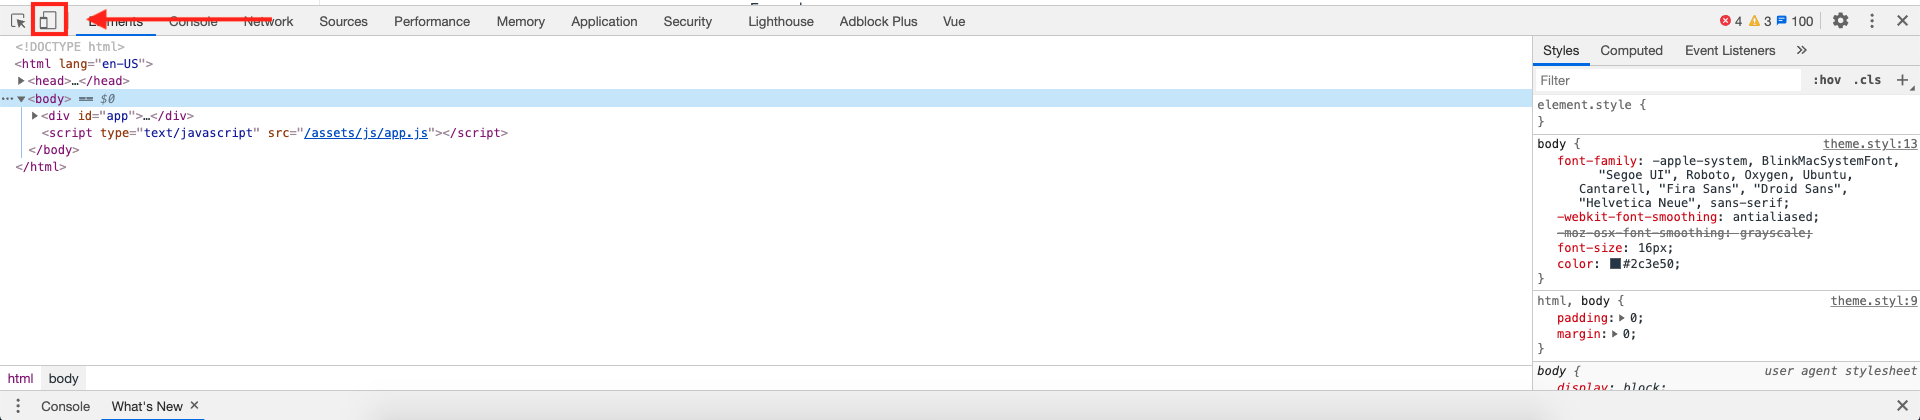
Once in the responsive view we can either select the presets for screen sizes from the top or resize the screen manually by clicking and dragging the screen from one side. 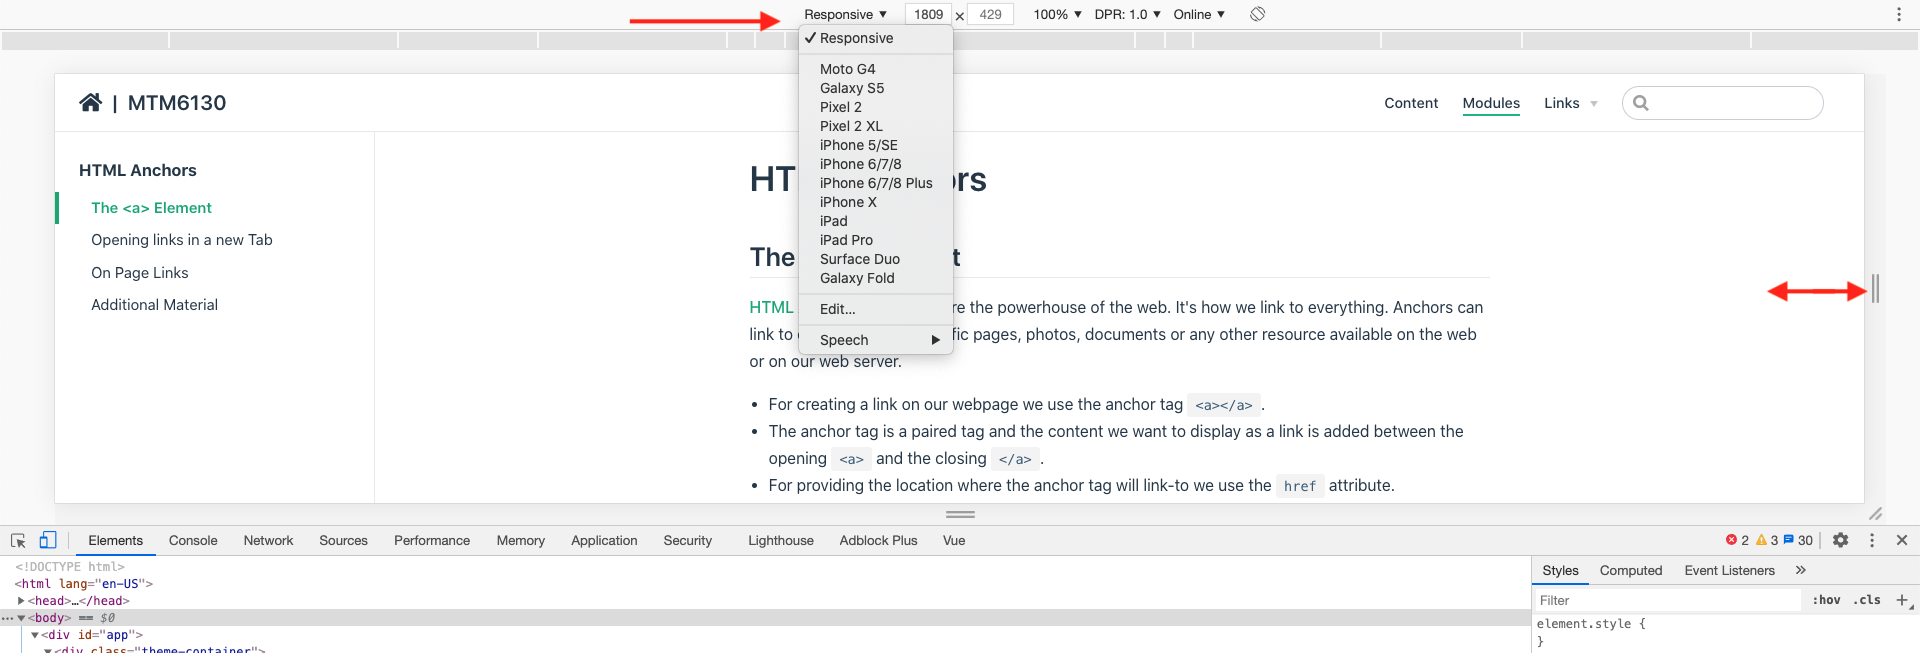
Manipulating HTML
Using the Elements tab we can interact with the HTML of the webpage and perform the following actions:
- Finding elements - click through the elements and unfold them to see the content of each elements
- Editing elements - edit elements by double clicking on the tag name
- Editing attributes - double click on the attribute name
- Delete element - select the element and then press delete
- Rearrange elements - Drag and drop elements to check different arrangement
Manipulating CSS
We can use the CSS panel in the Elements tab to add new properties, remove existing properties and modify value of existing properties.
- Change property name - click directly on the property name to change it
- Edit property value - click directly on the property value to edit it
- Toggle property - click on the checkbox in-front of the property to toggle it on or off
- Strike through - Properties that are either in-correct or overwritten by another property are displayed with a strike through
- Add new property - We can add new property by clicking on the curly brace
{at the top - User agent styles - the browsers default styles will be listed as "user agent"
Important
Any manipulations we do in the dev tools will not be saved in our files and will be lost when we refresh the page.
- Here is an article for setting up workspaces in chrome to save your code in your files.
- You can also use extensions that can be used to save the manipulations form dev tools into the files directly.